

You’ve probably wondered whether your Facebook, Twitter, or [fill-in-the-blank-social-media-site] really makes a difference when it comes to marketing your books or building your platform.
Before I describe a few ways to specifically analyze how your social media might be leading to hard results, first I want to acknowledge that social media doesn’t have to lead to book sales to be invaluable. Relationship building is a central benefit of social media—it helps you develop connections with influencers and contribute to conversations that may lead to opportunities down the road.
Also, being active online, consistently, over a long period of time, can contribute to gaining visibility and readership that’s difficult to measure through analytics tools alone.
Still, it’s good to have a good idea of how your efforts might be having a positive effect, or none at all. The easiest way to do that is to (1) track how often people end up at your website as a result of seeing your social media activity, and (2) track people’s engagement with your posts.
Method 1: Use Google Analytics
Google Analytics is a free tool to help you study your website traffic and audience. You generally need a self-hosted site to use Analytics (find out how to self-host your site here), but it’s possible to use it with Blogger- and Tumblr-based sites, too.
You’ll want to use Google Analytics to look at several data points:
- The percentage of traffic to your website originating from social media
- Which social media sites dominate in sending you traffic
- How much that traffic has changed over time
- If social media sites send you new visitors and/or engaged visitors
In Google Analytics, navigate to Acquisition > Channels to see the percentage of your website traffic originating from social media. Here’s an example:
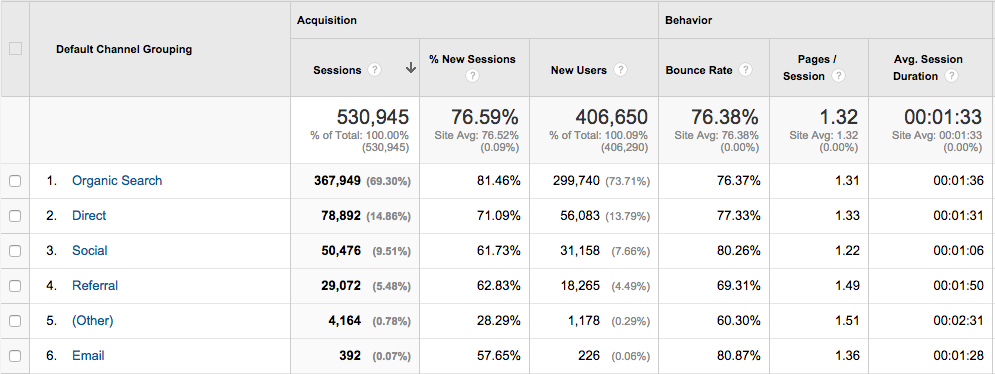
This chart shows that social media constitutes 9.5% of this site’s overall traffic. The most important traffic source for this site is not social, but organic search—nearly 70% of visitors land at this site after searching Google, Bing, etc.
To see if social is increasing or decreasing in importance as a source of traffic, compare this period of time to the previous period. Then check the percentage growth.
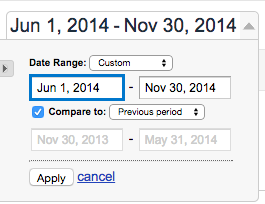
This tells us that traffic from social media has declined 6.32% versus the previous period. Why? It could be a variety of factors: less activity on social media, less engaging posts, less exposure or visibility of posts, fewer followers, fewer engaged followers, etc.
OK, so social media traffic is down. Is it down from all sources, or is there one source to blame? Let’s find out.
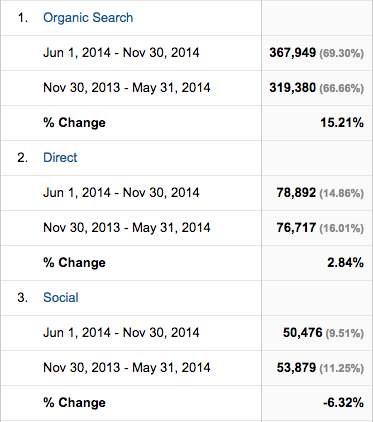
Go to Acquisition > Social > Network Referrals. Here’s an example of what you’ll see.
This shows us that Facebook (38%) and Twitter (36%) are the biggest drivers of social traffic to this site. Two interesting data points to look at: the average session duration and pages per session. If the session time is low, that means the visitors are likely unengaged and not particularly relevant to you or valuable (or your website could be really bad). See the StumbleUpon visitors—even though there’s a high number of them, they spend an average of 21 seconds on the site, whereas a visitor from Blogger spends an average of 2:14m on the site. That indicates a more valuable and relevant reader coming from Blogger. A high number of pages per session also indicates higher engagement and a more valuable visitor to you.
So, let’s compare periods as we did before, and see what happens.
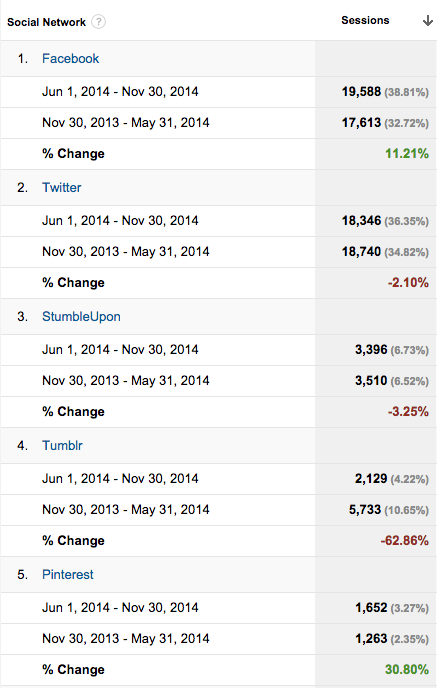
Traffic is increasing from Facebook and Pinterest; it’s on a sharp decline from Tumblr. Twitter and StumbleUpon are mostly neutral, but slightly down. How you interpret this, again, depends on how your activity might have changed over time. If it hasn’t changed, that might indicate a change by the social media network in how and when it’s showing your posts. It could also indicate a growth or decline in that social media network’s popularity and/or user base.
You can go even deeper by clicking on the specific social media network in this results chart, and seeing where the traffic is going on a page-by-page basis. You’ll see very quickly if a particular page or post is getting the lion’s share of traffic.
If you become an expert at using Google Analytics, you can set up “goals” related to visitors who come to your site from social media, and track how often those “goals” are met. A goal might be signing up for your e-mail newsletter, clicking on a particular series of pages, or making a purchase at your site.
Method 2: Use Analytics Specific to the Social Media Network
Whether you have Google Analytics or not, you can pull valuable information from analytics provided by the social media tool itself. For example, here’s what I can learn from my own recent Twitter use from Twitter’s analytics. (To find yours, go to the Twitter website, click on your profile icon, then choose “Analytics” from the menu.)
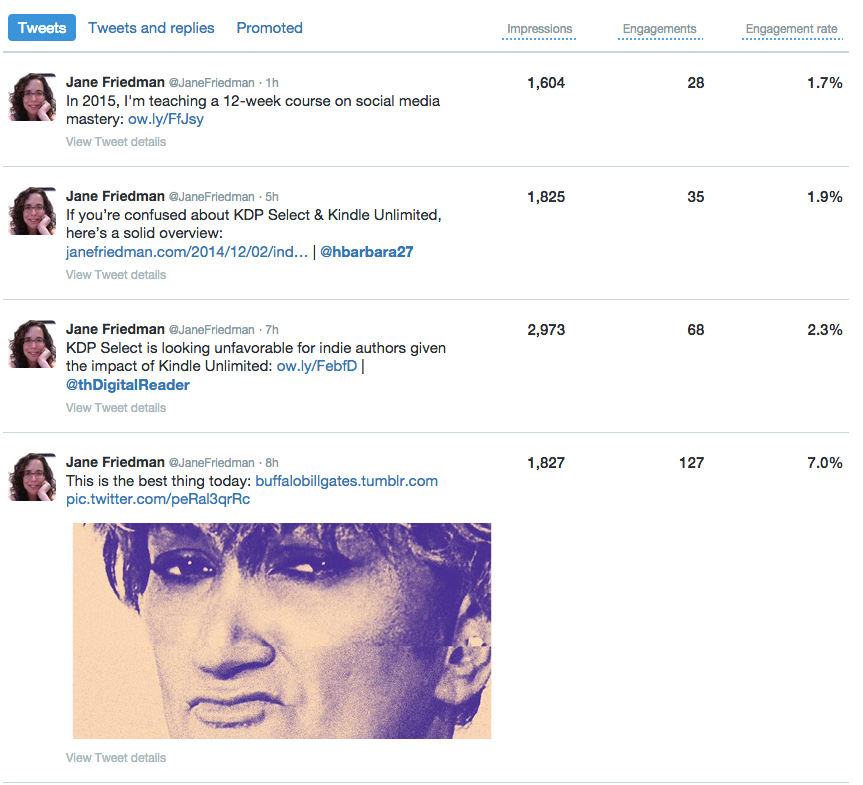
This shows engagement on a tweet-by-tweet basis. Twitter will also give you a 28-day rolling average for all your activity:
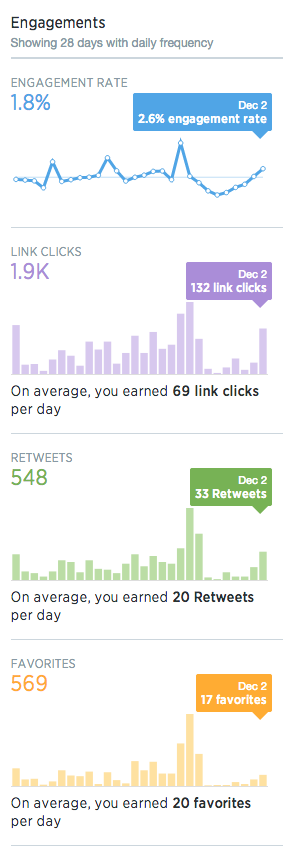
Facebook pages, Pinterest, Tumblr, and LinkedIn all offer similar tools for gauging the success of your content or posts.
So, Now What?
It’s always important to look at your analytics in the context of what content you post or distribute. For example, in my Twitter analytics screenshot above, the post with the highest engagement included a picture and had nothing to do with the business of writing and publishing. I’d want to look closer at whether tweets with pictures always perform better (regardless of topic), and if my non-businessy tweets always do well. Also, if I notice my more self-promotional tweets always perform worst of all, how can I improve them or change my strategy?
If you find out that social media visitors seem to be a small percentage of your overall website traffic, or the lowest quality visitor, don’t automatically assume that social media doesn’t have any effect on your overall marketing or platform. There’s that whole relationship building aspect I mentioned earlier (it takes a social media village to market a book), plus readers may not visit your site if you’re not a blogger or otherwise giving them a specific reason to go there. So even if social media doesn’t have a particular impact on your site traffic, your activity likely has a positive effect on reader engagement—and that’s especially the case if you’re regularly sending people to Amazon or some other place where you can’t directly measure the results.

Jane Friedman has spent her entire career working in the publishing industry, with a focus on business reporting and author education. Established in 2015, her newsletter The Bottom Line provides nuanced market intelligence to thousands of authors and industry professionals; in 2023, she was named Publishing Commentator of the Year by Digital Book World.
Jane’s expertise regularly features in major media outlets such as The New York Times, The Atlantic, NPR, The Today Show, Wired, The Guardian, Fox News, and BBC. Her book, The Business of Being a Writer, Second Edition (The University of Chicago Press), is used as a classroom text by many writing and publishing degree programs. She reaches thousands through speaking engagements and workshops at diverse venues worldwide, including NYU’s Advanced Publishing Institute, Frankfurt Book Fair, and numerous MFA programs.


Social Media (along with how much time and money to invest in it) is a big of a tricky wicket. Like you I get less than 5% of my site traffic from social media. However depending on your readers, they may spend large quantities of their day on social media (and scant minutes reading a blog) so you’re capturing only a portion of your social media impact by measuring traffic.
As a brief data point when I launched my kickstarter campaign the vast majority of funding came from people on my email list, Facebook was a strong #2, and website traffic (people kicking the sidebar ad on my website) was a distant #3. So Facebook is <5% of my site traffic but accounted for close to 20% of my kickstarter funds!
Very excellent reminders—especially re: the role of email!
@janefriedman:disqus great post. I was thinking of writing something similar my self, comparing Google Analytics vs GetSocial.io (where I work) in social media impact/ROI.
We (GetSocial) tend to look at social media from a different perspective. We track & measure social sharing activities on a website and understand how those are generating business (traffic or sales/conversions).
We’re working with a new online newspaper in Portugal which has around 5M visitors a month. We’re helping them understand which of their users drives more traffic when sharing.
By doing so, the company can incentivize their behavior. There are some interesting stats on this. Mind these numbers: http://goo.gl/xMYTDt
Beforehand let me define a social user as a unique visitor who has shared something at least once.
Some (average) facts on this client:
– 1.3 shares per social user
– 4.9 visits generated per share
– Shares from 0.9% of daily traffic (social users) generate 6% of daily traffic
– A social user does, on average, 32% more visits than a non-social user.
– A social user does, on average, 82% more pageviews than a non-social user.
If you look at the top 3 influential folks, the data is amazing.
In a narrative, 3 people shared content 7 times. From those 7 shares, they generated 1,439 visits (205 visits per share, 41x more than the average user) and 1,732 pageviews.
These 3 people generated almost 1% of a online newspaper daily traffic. I believe this is huge and that this company in particular should engage these ‘influential users’.
Really fascinating perspective—thank you. Can you offer any insight as to how a person or business engages those influential users?
@janefriedman:disqus with bigger (volume) companies we work primarily with eCommerce & content websites. Here are some examples:
Content: We actually presented today the results to one of the newspaper and their ideas were amazing. We discovered that there were certain users generating 300-400 visits per share. This guys wanted to offer those users a column in their newspaper.
eCommerce: By finding users who generate traffic & shares, we are able to offer them discounts/affiliates through their behavior. It’s easier to explain and to tie to ROI.
[…] 2 Ways to Measure the Impact of Your Social Media Use […]
[…] software specific to the social media site. Jane Friedman has more on the latter two in her blog post on the […]
[…] Jane’s Post – 2 Easy Ways to Measure the Impact of Your Social Media Use […]
[…] Source: janefriedman.com […]
[…] your efforts you are seriously going to miss out! And there are many tools out there to help you gain insight into how your content is performing. Whether you have money to spend on campaigns or not, a […]
[…] Friedman, J. (December 3, 2014). 2 easy ways to measure the impact of your social media use. Retrieved from https://janefriedman.com/measure-impact-social-media-use/ […]
I just got a measure of my social media impact: to launch a new book, I gave away an older one. From Friday through Sunday, over 7000 people downloaded it. I couldn’t have done that if I didn’t have a platform, and the number of giveaways is a measure of “impact.” However, “impact” is a 2-way street, because 95% of the time, I’m just enjoying the interaction with people on SM. Marketing is like a favor I ask of them 5% of the time. To me, this is the best way to go, because I’m a human first and a businesswoman second.