
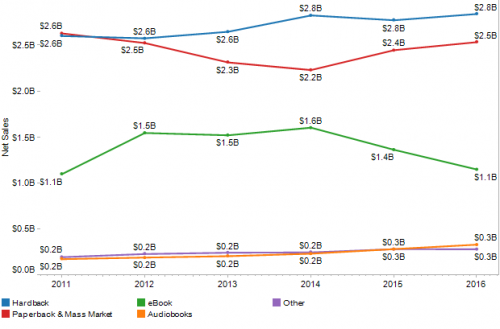
Closing image: It’s a low-res image, but an important one. This graphic from AAP StatShot shows the sales performance of trade book formats from traditional publishers between 2011 and 2016. The top blue line is hardcover; the red line is paperback and mass market (which has bounced back from a 2014 low); the green line is ebook; and the orange line at the bottom is digital audio. Learn more.

Jane Friedman has spent her entire career working in the publishing industry, with a focus on business reporting and author education. Established in 2015, her newsletter The Bottom Line provides nuanced market intelligence to thousands of authors and industry professionals; in 2023, she was named Publishing Commentator of the Year by Digital Book World.
Jane’s expertise regularly features in major media outlets such as The New York Times, The Atlantic, NPR, The Today Show, Wired, The Guardian, Fox News, and BBC. Her book, The Business of Being a Writer, Second Edition (The University of Chicago Press), is used as a classroom text by many writing and publishing degree programs. She reaches thousands through speaking engagements and workshops at diverse venues worldwide, including NYU’s Advanced Publishing Institute, Frankfurt Book Fair, and numerous MFA programs.